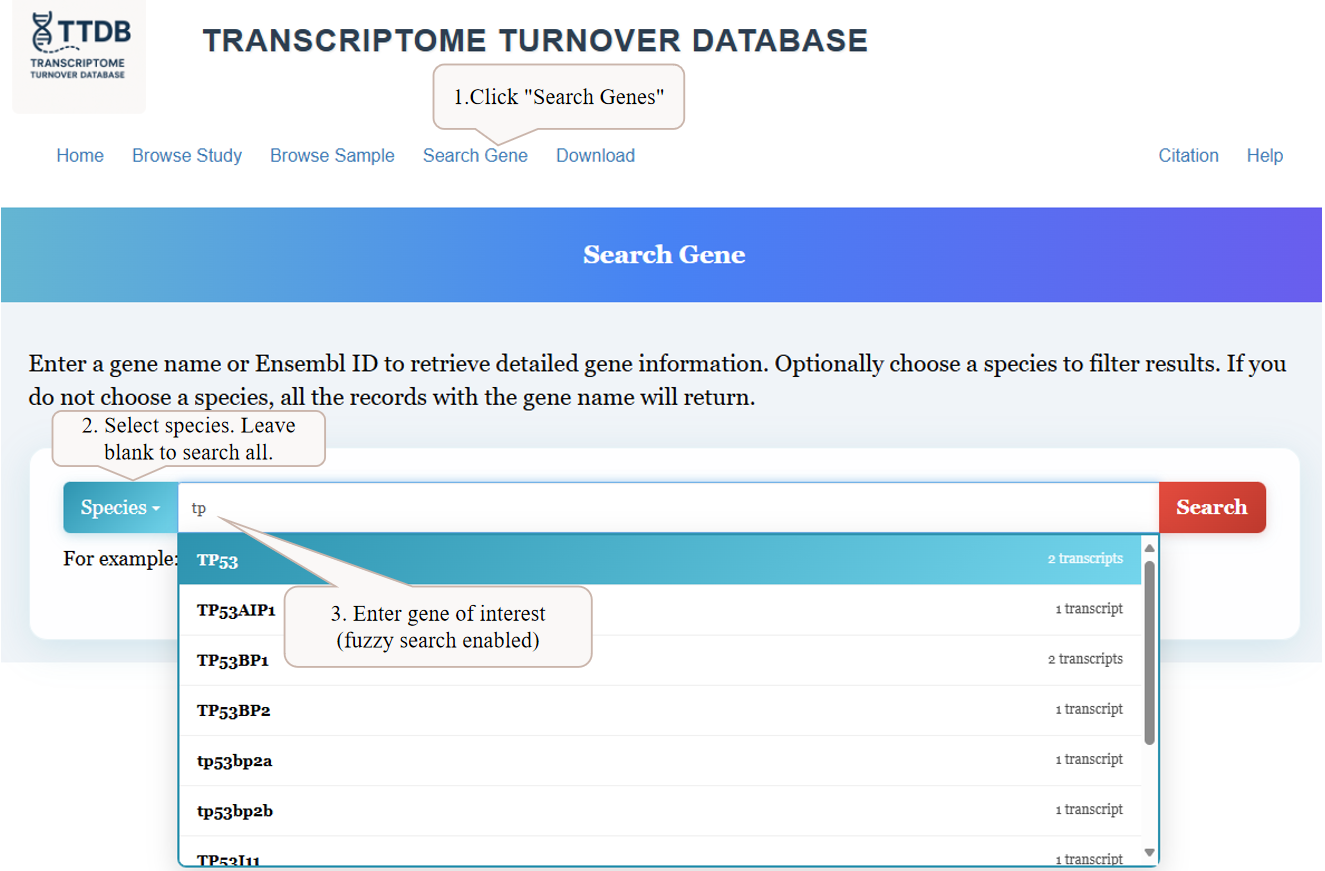
1Searching for a Gene of Interest
To begin, navigate to the 'Search Gene' page from the main menu. You can enter a gene name into the search bar. As you type, a list of matching genes will appear with fuzzy search enabled. You can also filter your search by selecting a specific species from the dropdown menu, or leave it blank to search across all available species.
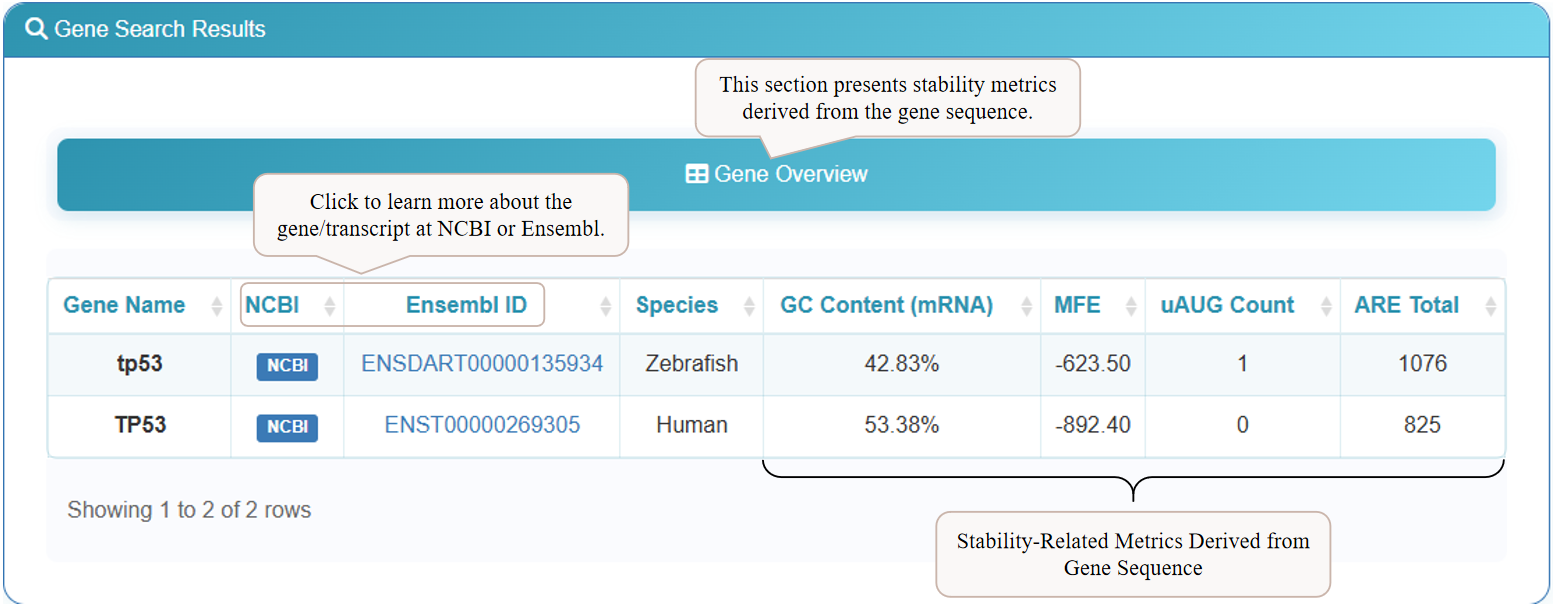
2Reviewing Computational Annotations
After searching, the results page will display a 'Gene Overview' table. This section provides key computational metrics derived directly from the gene sequence, such as GC Content, Minimum Free Energy (MFE), and counts of regulatory elements like upstream AUGs (uAUG Count) and AU-Rich Elements (ARE Total). For further details, click the 'NCBI' or 'Ensembl ID' links to visit the corresponding external databases.
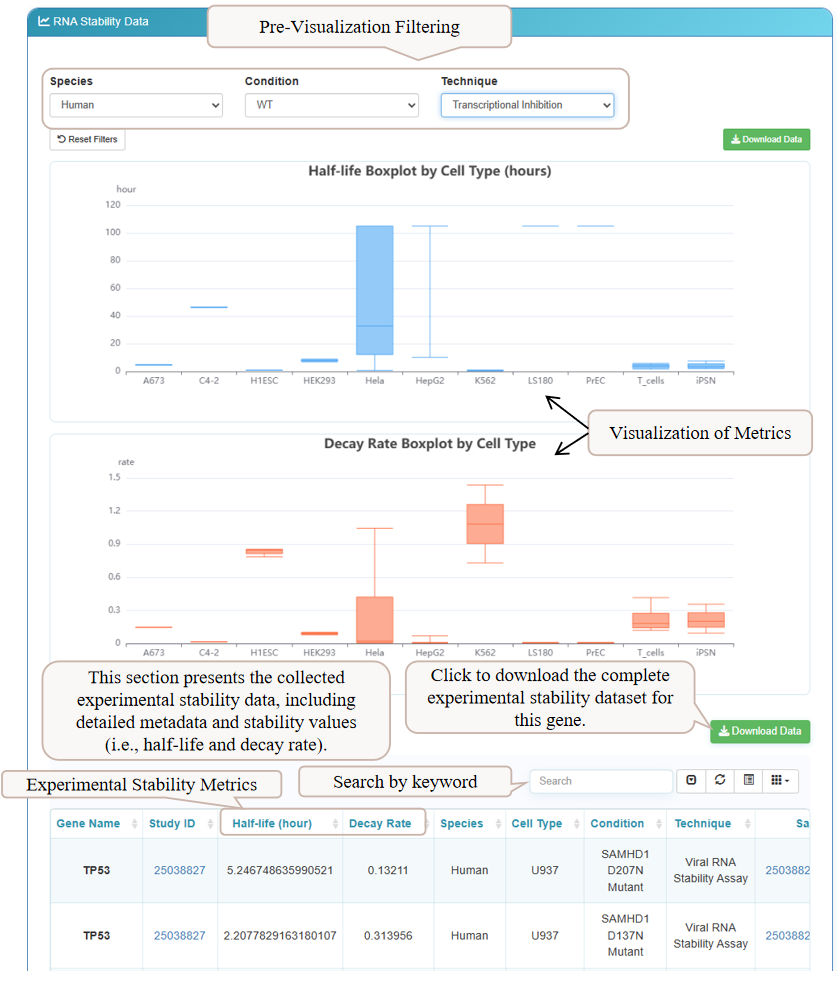
3Analyzing Experimental Stability Data
Scrolling down reveals the 'Experimental Stability Metrics' section. Here, you can explore experimental data from various studies. Interactive box plots provide a visual summary of half-life and decay rates across different cell types. Below, a detailed table lists stability values from each experiment. Use the filters at the top to narrow down results by species, condition, or technique, and download the data for the selected gene.
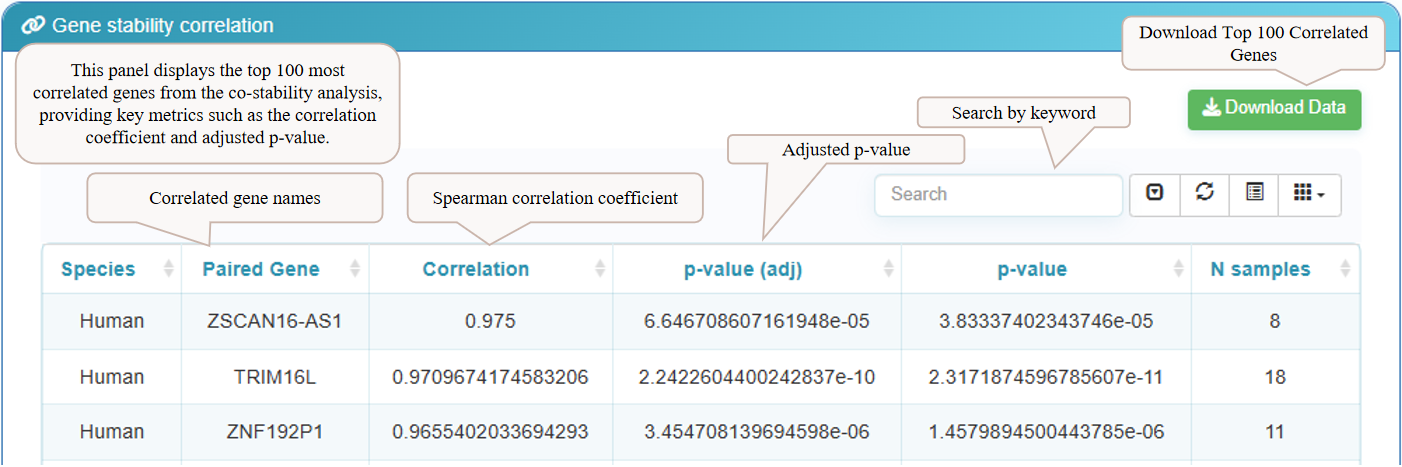
4Exploring Gene Stability Correlations
The final section on the results page is the 'Gene Stability Correlation' panel. This table displays the top 100 genes whose mRNA stability is most correlated with your gene of interest. Key metrics provided include the Spearman correlation coefficient and the adjusted p-value, allowing you to identify potential co-regulatory relationships. You can download the complete list of the top 100 correlated genes using the 'Download Data' button.